
ResponseTime Monitor Chrome 插件, crx 扩展下载
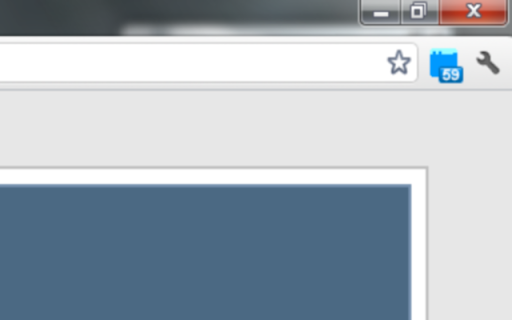

Shows the response times of up to three webservers. Useful to see how the internet/server connection performs.
What can I do with this extension?
Basically this extension shows you the response time of a webserver and draws a nice chart.
What can I do with this information?
You can see how your internet connection performs or how fast your own webserver responds.
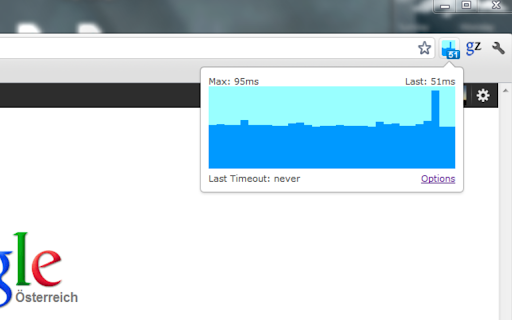
What does the chart show?
It shows the last 31 response times. Higher bars mean higher response times. If the request timed out it shows a red bar.
How can I interpret these response times?
If the bars are about the same height it is a sign for a healthy internet connection/server load. If there are red lines and blue lines mixed up or the chart is very volatile your internet connection is unstable or the server is overloaded. If it shows only red something is terribly wrong ...
Why does this need permission to "Your data on all websites"?
To perform checks to a user specific URL it is required that the extension can send requests to 'all websites'.
| 分类 | 💻开发者工具 |
| 插件标识 | bjgaobjkcmihhaiihefopfinhjaghfce |
| 平台 | Chrome |
| 评分 |
☆☆☆☆☆
|
| 评分人数 | |
| 插件主页 | https://chromewebstore.google.com/detail/responsetime-monitor/bjgaobjkcmihhaiihefopfinhjaghfce |
| 版本号 | 2.0 |
| 大小 | 49.63KiB |
| 官网下载次数 | 2000 |
| 下载地址 | |
| 更新时间 | 2020-03-15 00:00:00 |
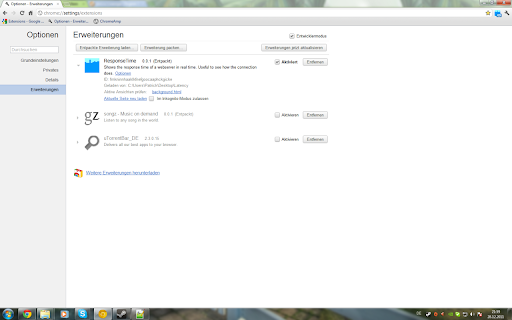
CRX扩展文件安装方法
第1步: 打开Chrome浏览器的扩展程序
第2步:
在地址栏输入: chrome://extensions/
第3步: 开启右上角的【开发者模式】
第4步: 重启Chrome浏览器 (重要操作)
第5步: 重新打开扩展程序管理界面
第6步: 将下载的crx文件直接拖入页面完成安装
注意:请确保使用最新版本的Chrome浏览器