
Google Analytics Debugger Chrome 插件, crx 扩展下载
Prints useful information to the JavaScript console by enabling the debug version of the Google Analytics Javascript.
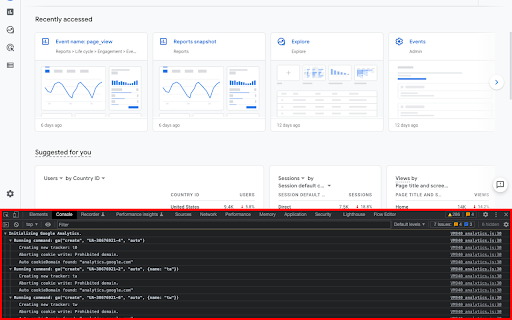
This extension loads the debug version of the Google Analytics Javascript for all sites you browse using Google Chrome. It prints useful information to the Javascript console. These messages include error messages and warnings which can tell you when your analytics tracking code is set up incorrectly. In addition, it provides a detailed breakdown of each tracking beacon sent to Google Analytics.
To use this extension, You need to follow three steps:
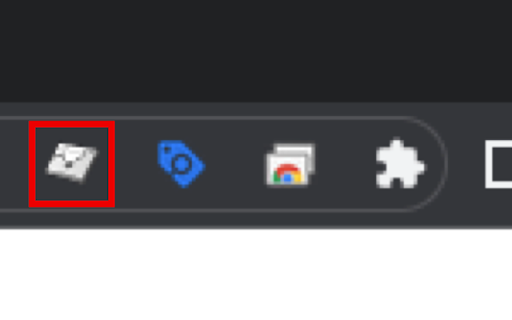
1. Turn it on by clicking its icon to the right of the address bar.
2. Open the Chrome Javascript console to see the messages.
On Windows and Linux, press Control-Shift-J.
On Mac, press Command-Option-J.
3. Refresh the page you are on.
By installing this extension, you agree to the Chrome Gallery Terms of Service at https://chrome.google.com/extensions/intl/en/gallery_tos.html
You can ask questions about the plugin and report bugs at [email protected]
New in this version:
- Upgraded to Manifest v3
| 分类 | 💻开发者工具 |
| 插件标识 | jnkmfdileelhofjcijamephohjechhna |
| 平台 | Chrome |
| 评分 |
★★★★☆
4.6
|
| 评分人数 | 80 |
| 插件主页 | https://chromewebstore.google.com/detail/google-analytics-debugger/jnkmfdileelhofjcijamephohjechhna |
| 版本号 | 3.0 |
| 大小 | 28.41KiB |
| 官网下载次数 | 500000 |
| 下载地址 | |
| 更新时间 | 2024-12-31 00:00:00 |
CRX扩展文件安装方法
第1步: 打开Chrome浏览器的扩展程序
第2步:
在地址栏输入: chrome://extensions/
第3步: 开启右上角的【开发者模式】
第4步: 重启Chrome浏览器 (重要操作)
第5步: 重新打开扩展程序管理界面
第6步: 将下载的crx文件直接拖入页面完成安装
注意:请确保使用最新版本的Chrome浏览器
同类插件推荐

Debugger for Google Analytics 4 (GA4)
Browser DevTools extension for debugging Google An

Page Analytics (by Google)
The Page Analytics Chrome Extension allows you to

Datalayer Checker
The easiest way to debug and check the dataLayer i

dataslayer
Debug and test tag management (Google Tag Manager,

Da Vinci Tools
The Supermetrics Google Marketing Platform power t

GTM Sonar
Debug your page template to see if it works with G

Google Analytics Debugger
A browser extension for debugging Google Analytics

Tag Assistant Companion
The Tag Assistant Companion extension works with T

Tag Assistant
The Tag Assistant extension works with Tag Assista

Adswerve - dataLayer Inspector+
DataLayer Tools for Digital AnalystsThe Adswerve d

WASP.inspector: Analytics Solution Profiler
Digital analytics quality made easy▶ WASP.inspecto

Google Analytics Debugger
Prints useful information to the JavaScript consol

Analytics Debugger
Your Single Source of Truth (SSOT) for debugging a