
Information Visualization of Browser History Chrome 插件, crx 扩展下载
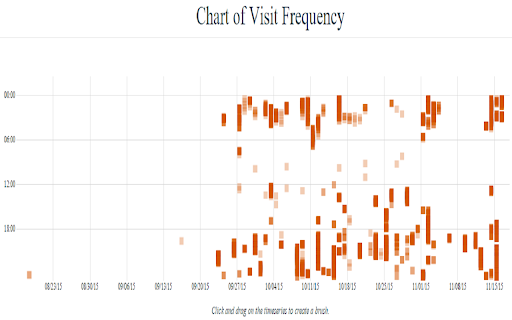
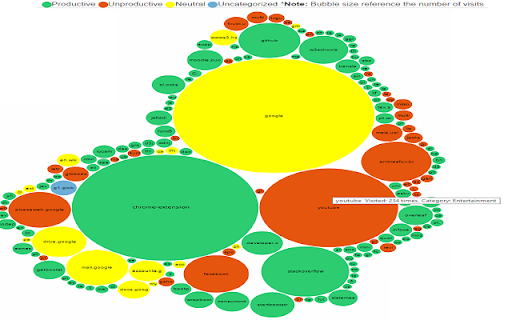
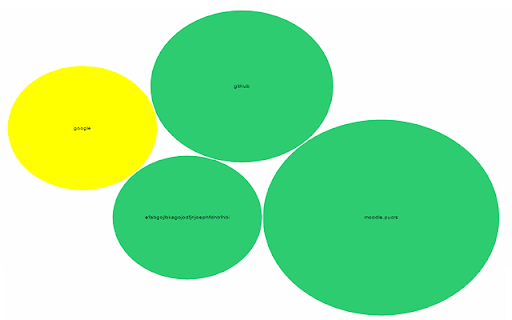
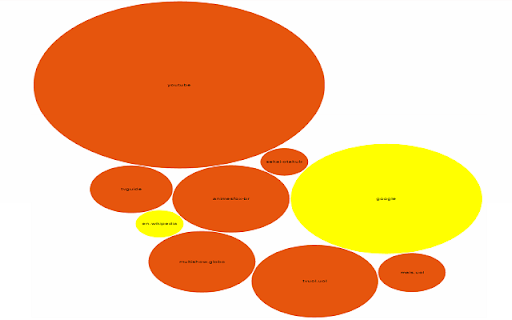
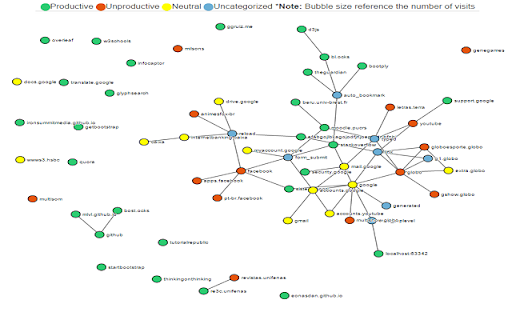
Reads your history, and use information visualization techniques to show graphically how you spend your time on the internet.
Reads your browser history, and use Information Visualization techniques (a branch of Computer Graphics), to show graphically how you spend your time on the Internet to analyze if you are productive or unproductive when using the Internet. According to a research done by Salary.com with ten thousand employees, most of them waste time on the Internet in websites unrelated to their work. The inefficient use of time by these employees during their working day costs to the US companies the equivalent of US $ 759 billion per year. The main distraction was the Internet activity indicated by 44.7% of respondents, generating a cost of around US$ 300 billion annually to companies. Thus, companies may adopt a measure to reduce this idle time with this software. This extension is not a tracking software, but a software to make a self-analysis to see where you are spending your time on the Internet, see the most visited websites, the behaviour on specific days by adding a date time filter, the behavior when clicking on links, like ads, and see the frequency of use of the internet and what are the accessed websites. The visual charts help to analyse the browser history, since lots of data are difficult to analyse in a text form. With this visual charts, you can see where you can improve your productivity.
| 分类 | 📝工作流程与规划 |
| 插件标识 | onlpodkdakgonlmodbgapcbigpcimokd |
| 平台 | Chrome |
| 评分 |
☆☆☆☆☆
|
| 评分人数 | |
| 插件主页 | https://chromewebstore.google.com/detail/information-visualization/onlpodkdakgonlmodbgapcbigpcimokd |
| 版本号 | 1.3.0 |
| 大小 | 13.3MiB |
| 官网下载次数 | 279 |
| 下载地址 | |
| 更新时间 | 2015-11-27 00:00:00 |
CRX扩展文件安装方法
第1步: 打开Chrome浏览器的扩展程序
第2步:
在地址栏输入: chrome://extensions/
第3步: 开启右上角的【开发者模式】
第4步: 重启Chrome浏览器 (重要操作)
第5步: 重新打开扩展程序管理界面
第6步: 将下载的crx文件直接拖入页面完成安装
注意:请确保使用最新版本的Chrome浏览器