
API Monitor Chrome 插件, crx 扩展下载
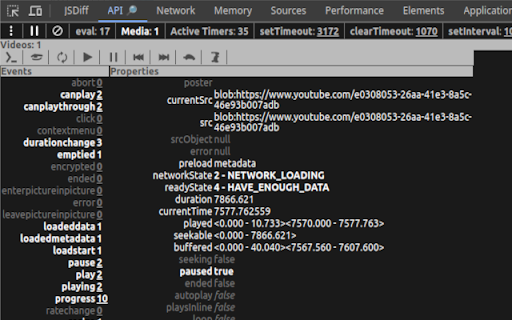
Show active intervals, scheduled timeouts, animation frames, idle callbacks, eval invocations, media events and properties
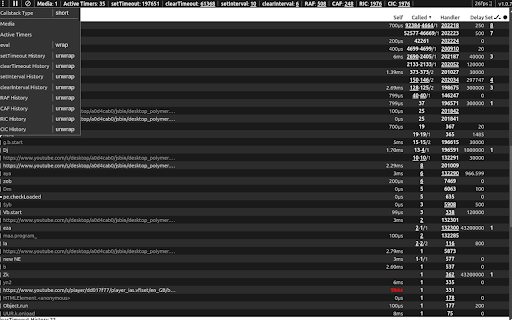
If you're web developer and want to assess implementation correctness - this tool adds additional panel to the browser’s DevTool that enables to see scheduled timeouts and active intervals, as well as to review and navigate to initiators of: eval, setTimeout, setInterval, requestAnimationFrame, requestIdleCallback and their terminator functions.
Allows:
- to measure callback execution self-time.
- to see requestAnimationFrame callback request frame rate.
- visit every function in the call stack (if available), bypass or pause while debugging.
- detect eval function usage, see its argument and return value, same for setTimeout and setInterval when called with a string instead of a function.
- for every mounted video or audio media element's to see it’s state and properties.
Helps to spot:
- incorrect timeout delay.
- bad handler for terminator function.
- terminating non existing or elapsed timeout.
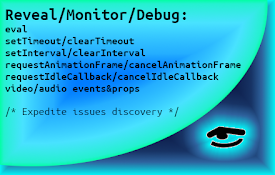
Motivation:
- To expedite issues discovery.
Wrapped native functions:
- eval (by default off)
- setTimeout
- clearTimeout
- setInterval
- clearInterval
- requestAnimationFrame
- cancelAnimationFrame
- requestIdleCallback
- cancelIdleCallback
Note:
- while measuring performance of your code – consider disabling this extension as it may affect the results.
Source code: https://github.com/zendive/browser-api-monitor
| 分类 | 💻开发者工具 |
| 插件标识 | bghmfoakiidiedpheejcjhciekobjcjp |
| 平台 | Chrome |
| 评分 |
★★★★★
5
|
| 评分人数 | 1 |
| 插件主页 | https://chromewebstore.google.com/detail/api-monitor/bghmfoakiidiedpheejcjhciekobjcjp |
| 版本号 | 1.0.9 |
| 大小 | 79.81KiB |
| 官网下载次数 | 60 |
| 下载地址 | |
| 更新时间 | 2025-02-15 00:00:00 |
CRX扩展文件安装方法
第1步: 打开Chrome浏览器的扩展程序
第2步:
在地址栏输入: chrome://extensions/
第3步: 开启右上角的【开发者模式】
第4步: 重启Chrome浏览器 (重要操作)
第5步: 重新打开扩展程序管理界面
第6步: 将下载的crx文件直接拖入页面完成安装
注意:请确保使用最新版本的Chrome浏览器
同类插件推荐

Liquidware Browser Monitor
Liquidware's Stratusphere™ UX browser monitorT
API Monitor
Show active intervals, scheduled timeouts, animati

Local Storage Inspector
Devtools extension to inspect local storageEasily

Qyrus API Discovery
Qyrus API DiscoveryTesting APIs has become easier

HTTP-TRACKER
Inspect HTTP request headers, cookies, data, respo

YMock: Mock API calls info
前端重构和开发时模拟后台接口返回数据的辅助开发工具。1.提高开发效率 再也不用来回调试接口,快速mo

Rest API Inspector
This will inspect all the REST API calls and downl

API Trace
This extension gives the consolidated view of all

Inspect API calls
Inspect API calls extensionUsing this extension yo

API Hunt
Learn about APIs as you browse the webDiscovering
ModResponse - Mock and replay API
Mock, modify, and replay API. Easy setup. No proxy
ChatGPT UI Preview
Introducing ChatGPT UI Preview! Now, seamlessly vi

StarterCSS
Rapidly implement CSS layouts, effects, and design