
htmx-debugger Chrome 插件, crx 扩展下载
htmx-debugger - a debugging tool for htmx applications
## Overview
htmx-debugger is a powerful browser extension (compatible with Chrome and Firefox) designed to help developers debug and analyze htmx applications. It provides a comprehensive and user-friendly interface for viewing htmx events, requests, and responses in real-time. This tool is essential for understanding and troubleshooting htmx-powered web applications, making the development process smoother and more efficient.
## Features
- Real-time capture and display of htmx events
- Intelligent grouping of related events for easier analysis
- Powerful search functionality to filter events
- One-click clear button to reset the debugger view
- Flexible event filtering (All, Request, Response)
- Collapsible event details for a cleaner interface
- Detailed timing information for request-response cycles
- Live connection status indicator
- Automatic periodic connection checks for improved stability
- Robust error handling and reporting
## Future
- Export functionality to save captured events as a JSON file
- Import capability to load and analyze events from a JSON file
## Usage
### Opening the Debugger
1. Navigate to a webpage that uses htmx.
2. Open Chrome DevTools (Right-click > Inspect or press F12).
3. Look for the "htmx" tab in the DevTools panel. If you don't see it, click on the ">>" icon to find it in the list of additional tools.
### Debugging htmx Events
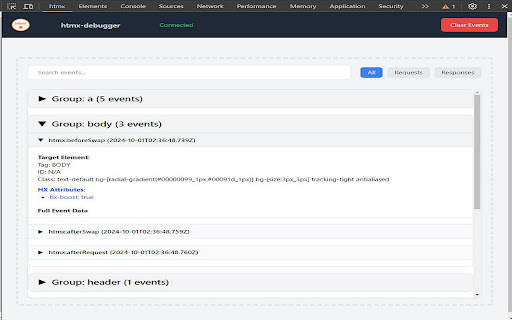
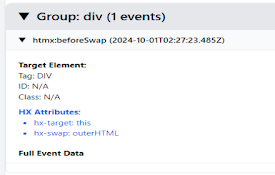
The debugger automatically captures htmx events as they occur on the page. Each event is displayed with the following information:
- Event type
- Timestamp
- Target element details
- Event-specific details
- XHR information (for relevant events)
### Using the Debugger Features
1. **Connection Status**: Check the connection status indicator in the panel header to ensure the debugger is properly connected.
2. **Search**: Use the search bar at the top to filter events based on their content.
3. **Clear**: Click the "Clear" button to reset the debugger and remove all captured events.
4. **Event Filtering**: Use the filter buttons to show all events, only requests, or only responses.
5. **Expand/Collapse**: Click on an event header to expand or collapse its details.
6. **Timing Information**: For grouped events, the total duration is displayed at the bottom of the group.
## Troubleshooting
- If you don't see any events in the debugger, ensure that the webpage you're debugging is actually using htmx.
- If the htmx tab doesn't appear in DevTools, try reloading the page or reopening DevTools.
- Check the browser console for any error messages related to the extension.
- If the connection status shows "Disconnected", try reloading the page.
- If problems persist, try disabling and re-enabling the extension, reloading the webpage, or restarting Chrome.
## Privacy Policy
htmx-debugger is committed to protecting user privacy and does not collect or use any personal user data. The extension operates solely within the context of the user's browser to provide debugging functionality for htmx applications.
### Permissions and Their Justifications
1. **alarms**: The alarms permission is used to schedule periodic connection checks, ensuring the debugger maintains a stable connection to the webpage. This improves the reliability of the debugging process.
### Single Purpose Description
The single purpose of htmx-debugger is to provide a comprehensive debugging tool for web developers working with htmx-powered applications. It captures, displays, and analyzes htmx events in real-time, offering insights into the behavior and performance of htmx interactions within web pages.
### Data Usage Compliance
htmx-debugger complies with the Chrome Web Store Developer Program Policies regarding data usage. The extension:
- Does not collect any personal user data
- Does not transmit any captured debugging information outside of the user's browser
- Only processes information necessary for its core debugging functionality
- Stores data locally and solely for the purpose of improving the user's debugging experience
By using htmx-debugger, users can be assured that their privacy is respected and that the extension operates within the bounds of its stated purpose as a development tool for htmx applications.
| 分类 | 💻开发者工具 |
| 插件标识 | fkpjmdhppdadklmcjbifffmjplgoboic |
| 平台 | Chrome |
| 评分 |
★★★★☆
4.3
|
| 评分人数 | 27 |
| 插件主页 | https://chromewebstore.google.com/detail/htmx-debugger/fkpjmdhppdadklmcjbifffmjplgoboic |
| 版本号 | 1.0.6 |
| 大小 | 71.28KiB |
| 官网下载次数 | 173 |
| 下载地址 | |
| 更新时间 | 2024-10-23 00:00:00 |
CRX扩展文件安装方法
第1步: 打开Chrome浏览器的扩展程序
第2步:
在地址栏输入: chrome://extensions/
第3步: 开启右上角的【开发者模式】
第4步: 重启Chrome浏览器 (重要操作)
第5步: 重新打开扩展程序管理界面
第6步: 将下载的crx文件直接拖入页面完成安装
注意:请确保使用最新版本的Chrome浏览器
同类插件推荐

Readable HackerNews
Stylish Hacker News.Announcement: This will be the

Rombo
Add beautiful, customisable animations to any webs

Netflix block synopsis spoiling
This extension hides synopses in episode carousels

UI Options Plus (UIO+)
User Interface Options Plus (UIO+) allows you to c

Gerador de Dados no Botão Direito
Gera dados no campo de texto utilizando o botão di

Chromium CodeSearch Theme
Displays chromium code search in a customized them

Punkjs
Punkjs is a Chrome extension that allows you to lo
htmx-debugger
htmx-debugger - a debugging tool for htmx applicat

UI Dux Chrome Extension
Seamlessly integrate high-quality, real-time updat

Svelte DevTools
Browser DevTools extension for debugging Svelte ap

Alpine.js devtools
DevTools extension for debugging Alpine.js applica

Gimli Tailwind
A DevTools extension enabling smart tools for Tail

Tailwind CSS Devtools
Tailwind CSS Developer ToolsAll-in-one browser ext